60 Incredible Virtual Event Statistics [2024 Research]

Table of Contents
This is a complete list of up-to-date virtual event statistics. We have collaborated with various companies in the B2B market segment and analyzed their data related to virtual events.
The virtual event stats in this article have a sample size of 3960 respondents.
The statistics are segmented by the following categories:
- Virtual Event Preparation
- Virtual Event Promotion
- Virtual Event Success and Challenges
- Virtual Event Audience Engagement
- Large Virtual Tradeshows
Without further ado, let’s dive right into the statistics!
60 Virtual Event Statistics
Virtual Event Statistics in the Preparation Phase
Let’s start with some statistics related to the preparation phase of virtual events. These statistics show the average costs of event attendees, the hosting platforms used by the industry, and the ideal timings for virtual events.
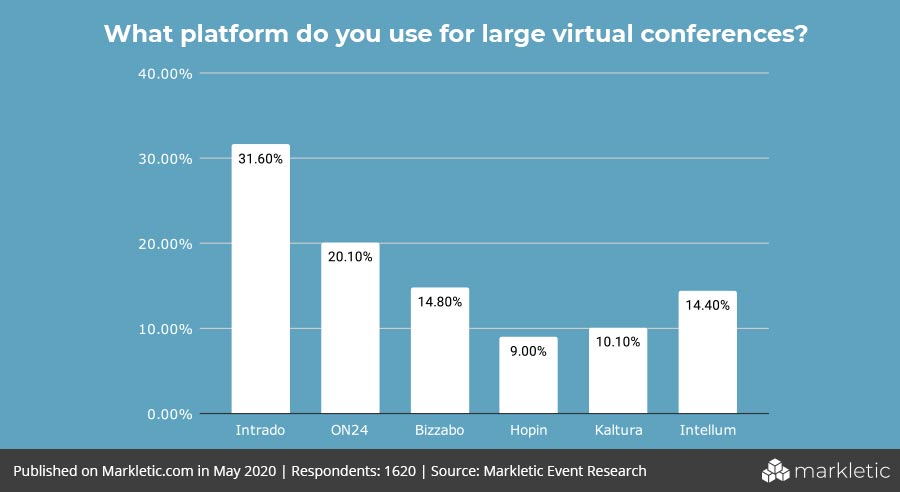
- 31.6% of B2B marketers use Intrado as their virtual event hosting platform for large conferences. 20.1% use ON24 as their preferred virtual conference platform.
- For small virtual events, most people need between 3-6 weeks to promote the event successfully.
- For large virtual conferences, 65% of marketers need more than 6 weeks to promote the event and drive the desired amount of registrations.
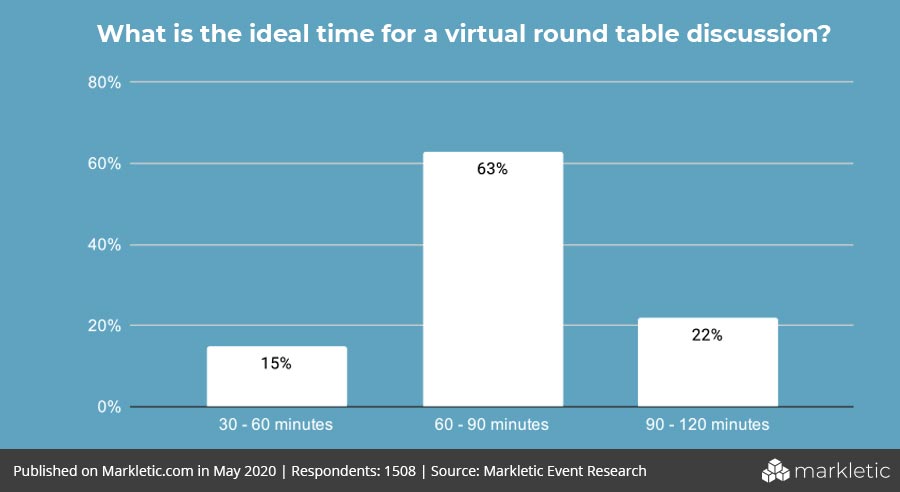
- 63% of people say that the ideal time for a virtual round table discussion is between 60 and 90 minutes.
- 70% of event organizers say that good microphones are critical to a successful event. Microphones are more important than a camera in which marketers ranked at 60% importance. Here is my recommendation for a cost-effective microphone on Amazon. It's the Blue Yeti.
- 41% of event organizers use Zoom for their small virtual events. The runner up is Microsoft Teams, which is used by 29% of marketers.
- The ideal audience size for a virtual round table discussion is between 8 and 10 people.
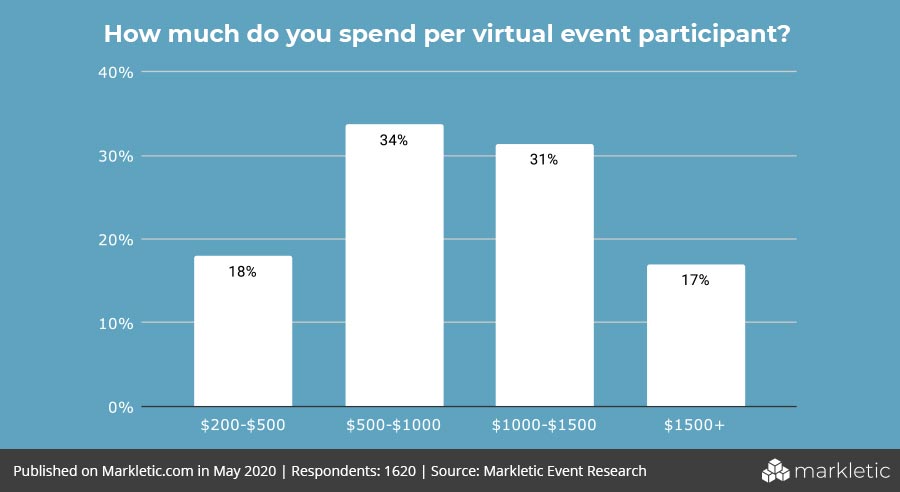
- 33.7% of marketers say that the average cost per virtual event attendee is between $500 - $1000.
- The average cost per attendee for a large virtual conference is slightly higher at $1000 - $1500.
- The most popular type of virtual event is small gatherings. This is followed by networking events and round table discussions.
- 67% of virtual events use external (customer) speakers.
- 56% of marketers say that it takes between 2-4 weeks to plan a small virtual event.
- 65% of event organizers accept sponsorships for their events.
Virtual Event Promotion Statistics
These statistics are related to the promotion phase of virtual events. These statistics show the main source of registrations. It will also tell you the average costs of sponsorship packages.
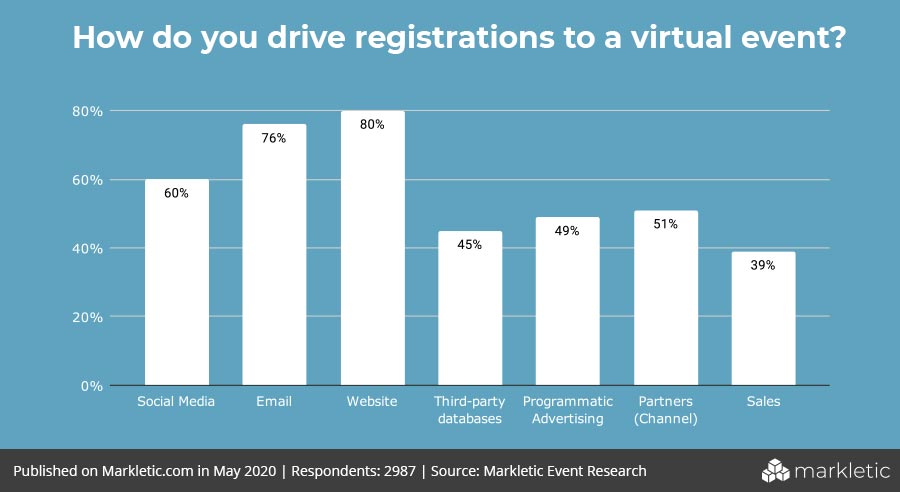
- 60% of virtual event organizers use social media to drive significant registrations.
- 76% of marketers say that email is the single most effective way to drive registrations.
- 49% of marketers say that programmatic advertising is a large contributor to event registrations.
- 51% of B2B companies use their business partners (channel) to drive registrations.
- 39% of marketers say that their sales teams generate a significant amount of registrations.
- B2B marketers mostly target decision-makers for their virtual events.
- The average sponsorship package for a virtual event costs $8,456.
- Chatbots are an effective way to drive more registrations.
- The average promotional period lasts 3.5 weeks.
- The average promotional period for C-level virtual events is 6 weeks.
Success and Challenges Statistics
These statistics will give you insights about the success metrics of virtual events. It will also show you what challenges exist when it comes to virtual events. This can help you to prepare better for virtual events and deal with challenges before they arrive.
- Audience engagement is the largest challenge when it comes to virtual events. The next biggest challenge is interaction.
- 38% of marketers say they run into technical problems when hosting virtual events.
- The average no-show percentage of virtual events is 35%. This is slightly higher than in-person events.
- 80% of people join virtual events for educational purposes. The next biggest reason for joining virtual events is networking.
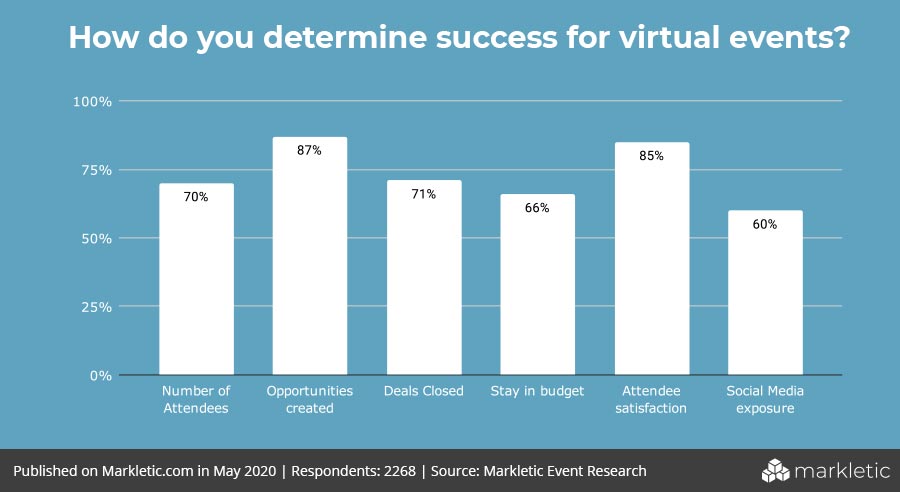
- 87% of marketers consider the opportunities generated by virtual events as a success factor.
- 71% of event organizers rank deals closed as a success factor.
- Attendee satisfaction is considered a success factor by 85% of marketers.
- 93% of virtual event organizers use surveys to measure attendee satisfaction.
- 68% of event organizers use the feedback received from their sales team to determine attendee satisfaction.
- 63% of virtual event organizers plan to invest more in virtual events next year (2025).
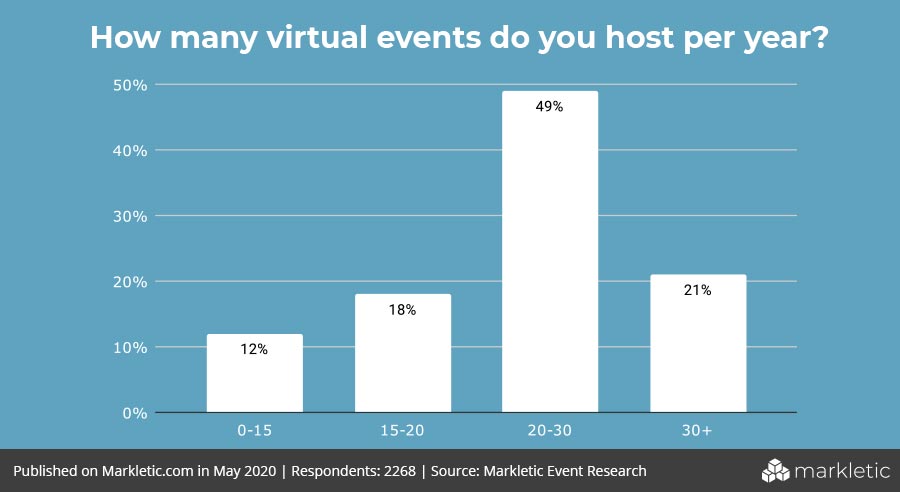
- 48% of businesses organize between 20-30 per year.
- 67% of businesses use virtual events complementary to in-person events.
- 45.7% of marketers say the primary goal of virtual events is to generate pipeline.
- Most companies allocate between 10-20% of their marketing budget to virtual events.
- The majority of the budget per virtual event is spent on the hosting platform. The second-largest pool of costs is speakers and moderators.
- 65.9% of event organizers make their virtual events available on-demand after the fact.
- The biggest annoyance of virtual events is a bad connection. The second-largest frustration comes from bad microphones.

Virtual Event Audience Engagement Statistics
Audience engagement is key when it comes to events. These statistics will give you insights as to what is preferred by the audience when it comes to audience engagement. How can you get the most out of your virtual by engaging the audience?
- 49% of marketers say that audience engagement is the biggest contributing factor to having a successful event.
- Only 30% of event organizers send their attendees giveaways.
- 81.8% of virtual event organizers use event polling to improve interaction.
- 68% of B2B companies hire external moderators for their virtual round table discussions
- Only 20.1% of marketers live-stream their events to social media.
- 30% of business use an event application for their virtual events
- The main reason for using an event application is for session registration and an agenda overview.
- 78% of businesses that use an event application say it contributes to a positive event ROI.
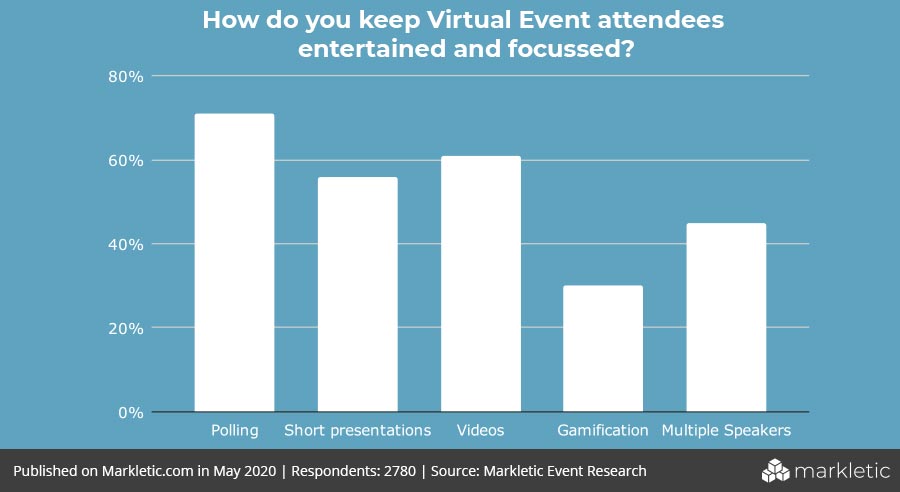
- 71% of marketers use polling to make sure that their audience doesn’t lose attention.
- 61% of marketers use videos as an interactive element to keep people engaged.
Large Virtual Tradeshow Statistics
Some statistics are unique to larger virtual events of at least 1000+ attendees.
- 87% of event organizers opt for virtual event platforms that have virtual sponsorship booth capabilities.
- 70.6% of event organizers are looking for marketing automation integrations when selecting a virtual event platform.
- 68% of marketers say that one-on-one meetings at large virtual events help to improve audience satisfaction.
- 74% of event organizers say that it takes longer than one month to configure their virtual event platform.
- 63% of event organizers opt for a semi-live approach to sessions, meaning sessions are pre-recorded but there is a live Q&A.
- 91% of event organizers allow sessions to be sponsored to generate extra sponsorship revenue.
- 59% of event organizers have gamification strategies to improve audience engagement.
- 74% of B2B event organizers only see a positive return on investment at least 6 months after the virtual event.
- 34% of event organizers send virtual gift bags to their attendees.
- 45% of event organizers opt for shorter multi-day events to combat virtual event fatigue.
Conclusion
Hopefully, these 60 virtual event statistics will give you insights into how to best set up your virtual events.
Now I’d like to hear your thoughts!
Which statistic was most surprising to you? Let me know in the comment sections.
If this article inspired you to host virtual events, then check out this article of mine. In this article, I give you a step-by-step guide on how to set up virtual events. Alternatively, if you want to host a virtual round table discussion, then read this guide on how to set them up effectively.
Extra Resources:
Share this article


Hey,
Can you define what "virtual round table" means in the first few points?
Thanks!
Hi! A virtual round table is basically an interactive conversation between people without looking at slides. The aim is to learn from each other. Have a look here: https://markletic.com/blog/how-to-host-a-virtual-roundtable-discussion-that-converts/
What locations were the virtual respondents from? All located in the United States, multiple countries, one state? Thank you!
About 65% is from the USA. 30% is from Europe and 5% from other countries across the world. Hope this helps!
The article says: "81% of virtual event organizers use social media to drive registrations", but the figure shows 60%. Which one is correct?
Good catch! I've changed the copy. 60% is the right number.
Do the respondents organize paid events or free events?
Hey, a mix of both!